Vehicle manufacturers may be collectively disappointed learning that, for the first time in the 28-year history of the J.D. Power U.S. Automotive Performance, Execution and Layout (APEAL) Study, there is a consecutive year-over-year decline in owner satisfaction.
According to the 2023 study, released July 20, overall satisfaction is 845 (on a 1,000-point scale), a decrease of 2 points from a year ago and 3 points lower than in 2021.
“The decline in consecutive years might look small, but it’s an indicator that larger issues may lie under the surface,” said Frank Hanley, senior director of auto benchmarking at J.D. Power. “Despite the technology and design innovations that manufacturers put into new vehicles, owners are lukewarm about them. While innovations like charging pads, vehicle apps and advanced audio features should enhance an owner’s experience, this is not the case when problems are experienced. This downward trajectory of satisfaction should be a warning sign to manufacturers that they need to better understand what owners really want in their new vehicles.”
The study is based on 10 factors---nine of which have declined year over year. The only factor to improve is fuel economy (771), which is 15 points higher than in 2022.
The factor with the largest year-over-year decline is exterior, decreasing to 888 from 894. Satisfaction with exterior styling on new models in 2023 is particularly unremarkable, scoring only 3 points above carryover models.
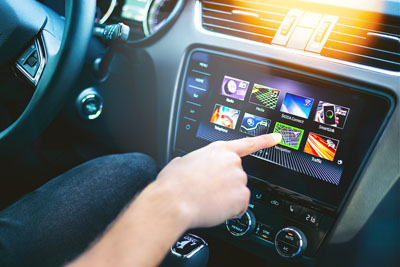
Built-in infotainment systems are a prime example of a technology not resonating with today’s buyers. Only 56% of owners prefer to use their vehicle’s built-in system to play audio, down from 70% in 2020. Three of the most common uses for built-in systems are: owners looking to make phone calls; voice recognition; and navigation---with less than half (45%, 37% and 43%, respectively) of owners preferring to use their vehicle’s built-in system for these functions.
The APEAL Study complements the J.D. Power U.S. Initial Quality Study (IQS) and the J.D. Power U.S. Tech Experience Index (TXI) Study by measuring owners' emotional attachment and level of excitement with their new vehicle. The APEAL Study asks owners to consider 37 attributes, ranging from the sense of comfort they feel when climbing into the driver's seat to their exhilaration when they step on the accelerator. Vehicle owners' responses to queries about these attributes are aggregated to compute an overall APEAL Index score.
Key Findings of the 2023 Study
Both premium and mass market segments decrease in overall satisfaction: Year over year, satisfaction declines 4 points among mass market brands and 1 point among premium brands. The gap in satisfaction between the two segments widens to 34 points this year.
Android Automotive Operating System (AAOS) with GAS delights owners: Models that have AAOS with Google Automotive Services (GAS) score higher in the infotainment category than those with no AAOS whatsoever. AAOS without GAS receives the lowest scores for infotainment of the three categories.
Satisfaction with fuel economy better among BEVs than gas-powered vehicles: For a second consecutive year, battery electric vehicles (BEVs) outperform internal combustion engine (ICE) vehicle counterparts in fuel economy, the only factor showing improvement in this year’s study. Even with gas prices declining, the large gap in satisfaction continues between ICE vehicles (758) and BEVs (797) for fuel economy/range scores.
Electrified vehicles close APEAL gap with gas vehicles: The overall APEAL Index score for gasoline-powered vehicles is 843, tied with plug-in hybrids. In comparison, BEVs (excluding Tesla) increased 2 points year over year to 840 and have closed the gap in satisfaction with gas-powered vehicles to 3 points. Tesla vehicles are summarized separately due to their high weight in the BEV segment. It is notable that certain attributes of Tesla models continue to outperform other BEVs, though there are challengers emerging from traditional manufacturers, including five BEV models that receive segment awards.
Satisfaction with Tesla declines: Tesla, with a score of 878, remains one of the higher performing brands in the industry. However, the score in 2023 is 9 points lower than a year ago when Tesla was first included in the study. Satisfaction scores for Tesla have declined year over year in all 10 factors. Because Tesla does not allow J.D. Power access to owner information in the states where that permission is required by law, Tesla models remain ineligible for awards.
Highest-Ranking Brands
Jaguar ranks highest among premium brands with a score of 887. Land Rover (883) and Porsche (883) rank second in a tie, while BMW (878) ranks fourth.
Dodge ranks highest among mass market brands for a fourth consecutive year, with a score of 887. Ram (873) ranks second and GMC (858) ranks third.
Model-Level APEAL Awards
Setting a record for the most model-level awards (for models ranking highest in their respective segments) is Hyundai Motor Group (nine awards), followed by BMW AG (five awards) and Toyota Motor Corporation (three awards).
The complete list of award recipients is:
- Hyundai Motor Group: Genesis GV60, Hyundai Santa Cruz, Kia Carnival, Kia EV6, Kia Forte, Kia K5, Kia Rio, Kia Stinger and Kia Telluride
- BMW AG: BMW 7 Series, BMW X4, BMW iX, MINI Cooper and MINI Countryman
- Toyota Motor Corporation: Lexus IS, Lexus RX and Toyota Sequoia
- Nissan Motor Co., Ltd.: Nissan Ariya and Nissan Titan
- Volkswagen AG: Porsche 911 and Porsche Taycan
- Stellantis NV: Dodge Challenger
- Mercedes-Benz Group AG: Mercedes-Benz CLA
- General Motors Company: Chevrolet Blazer
- Jaguar Land Rover Limited: Land Rover Range Rover
The Porsche 911 is the highest-ranking individual model (914). Kia sets a record for most brand awards in a single year with seven. The Kia K5 receives a model-level award for a third consecutive year.
The 2023 U.S. APEAL Study is based on responses from 84,555 owners of new 2023 model-year vehicles who were surveyed after 90 days of ownership. The study was fielded from February through May 2023, based on vehicles registered from November 2022 through February 2023.
Source: J.D. Power


