
Enterprise released its quarterly length of rental (LOR) data for Q2 2024, showing it has continued to decline from 2023's peak but remains significantly higher than before the COVID pandemic.
Overall LOR for collision-related rentals in Q2 2024 was 16.0 days, a 1.4-day decline from Q2 2023. Traditionally, LOR continues a decrease from Q1 into Q2, with June seeing an increase. As was observed in Q1 2024, that trend continued, though the traditional June rise did not occur in 2024.
Alaska had the highest overall LOR in Q2 2024 at 20.7 days, followed by Colorado and West Virginia, both at 19.4 days. New Mexico was right behind at 19.2 days.
North Dakota had the lowest LOR at 11.1 days, with Washington, D.C., at 12.3 days and Iowa at 12.6 days.
Montana had the largest LOR drop, down 3.1 days from Q2 2023 to 16.7. Washington was close behind, recording a drop of 2.9 days to 16.3.
Only West Virginia had an LOR increase in Q2 2024 compared to Q2 2023, up one-half day to 19.4 days. Maine was the only state to have flat LOR results at 16.0 days. All other states, plus D.C., saw LOR drop, with 24 states recording at least a 1.5-day decline.
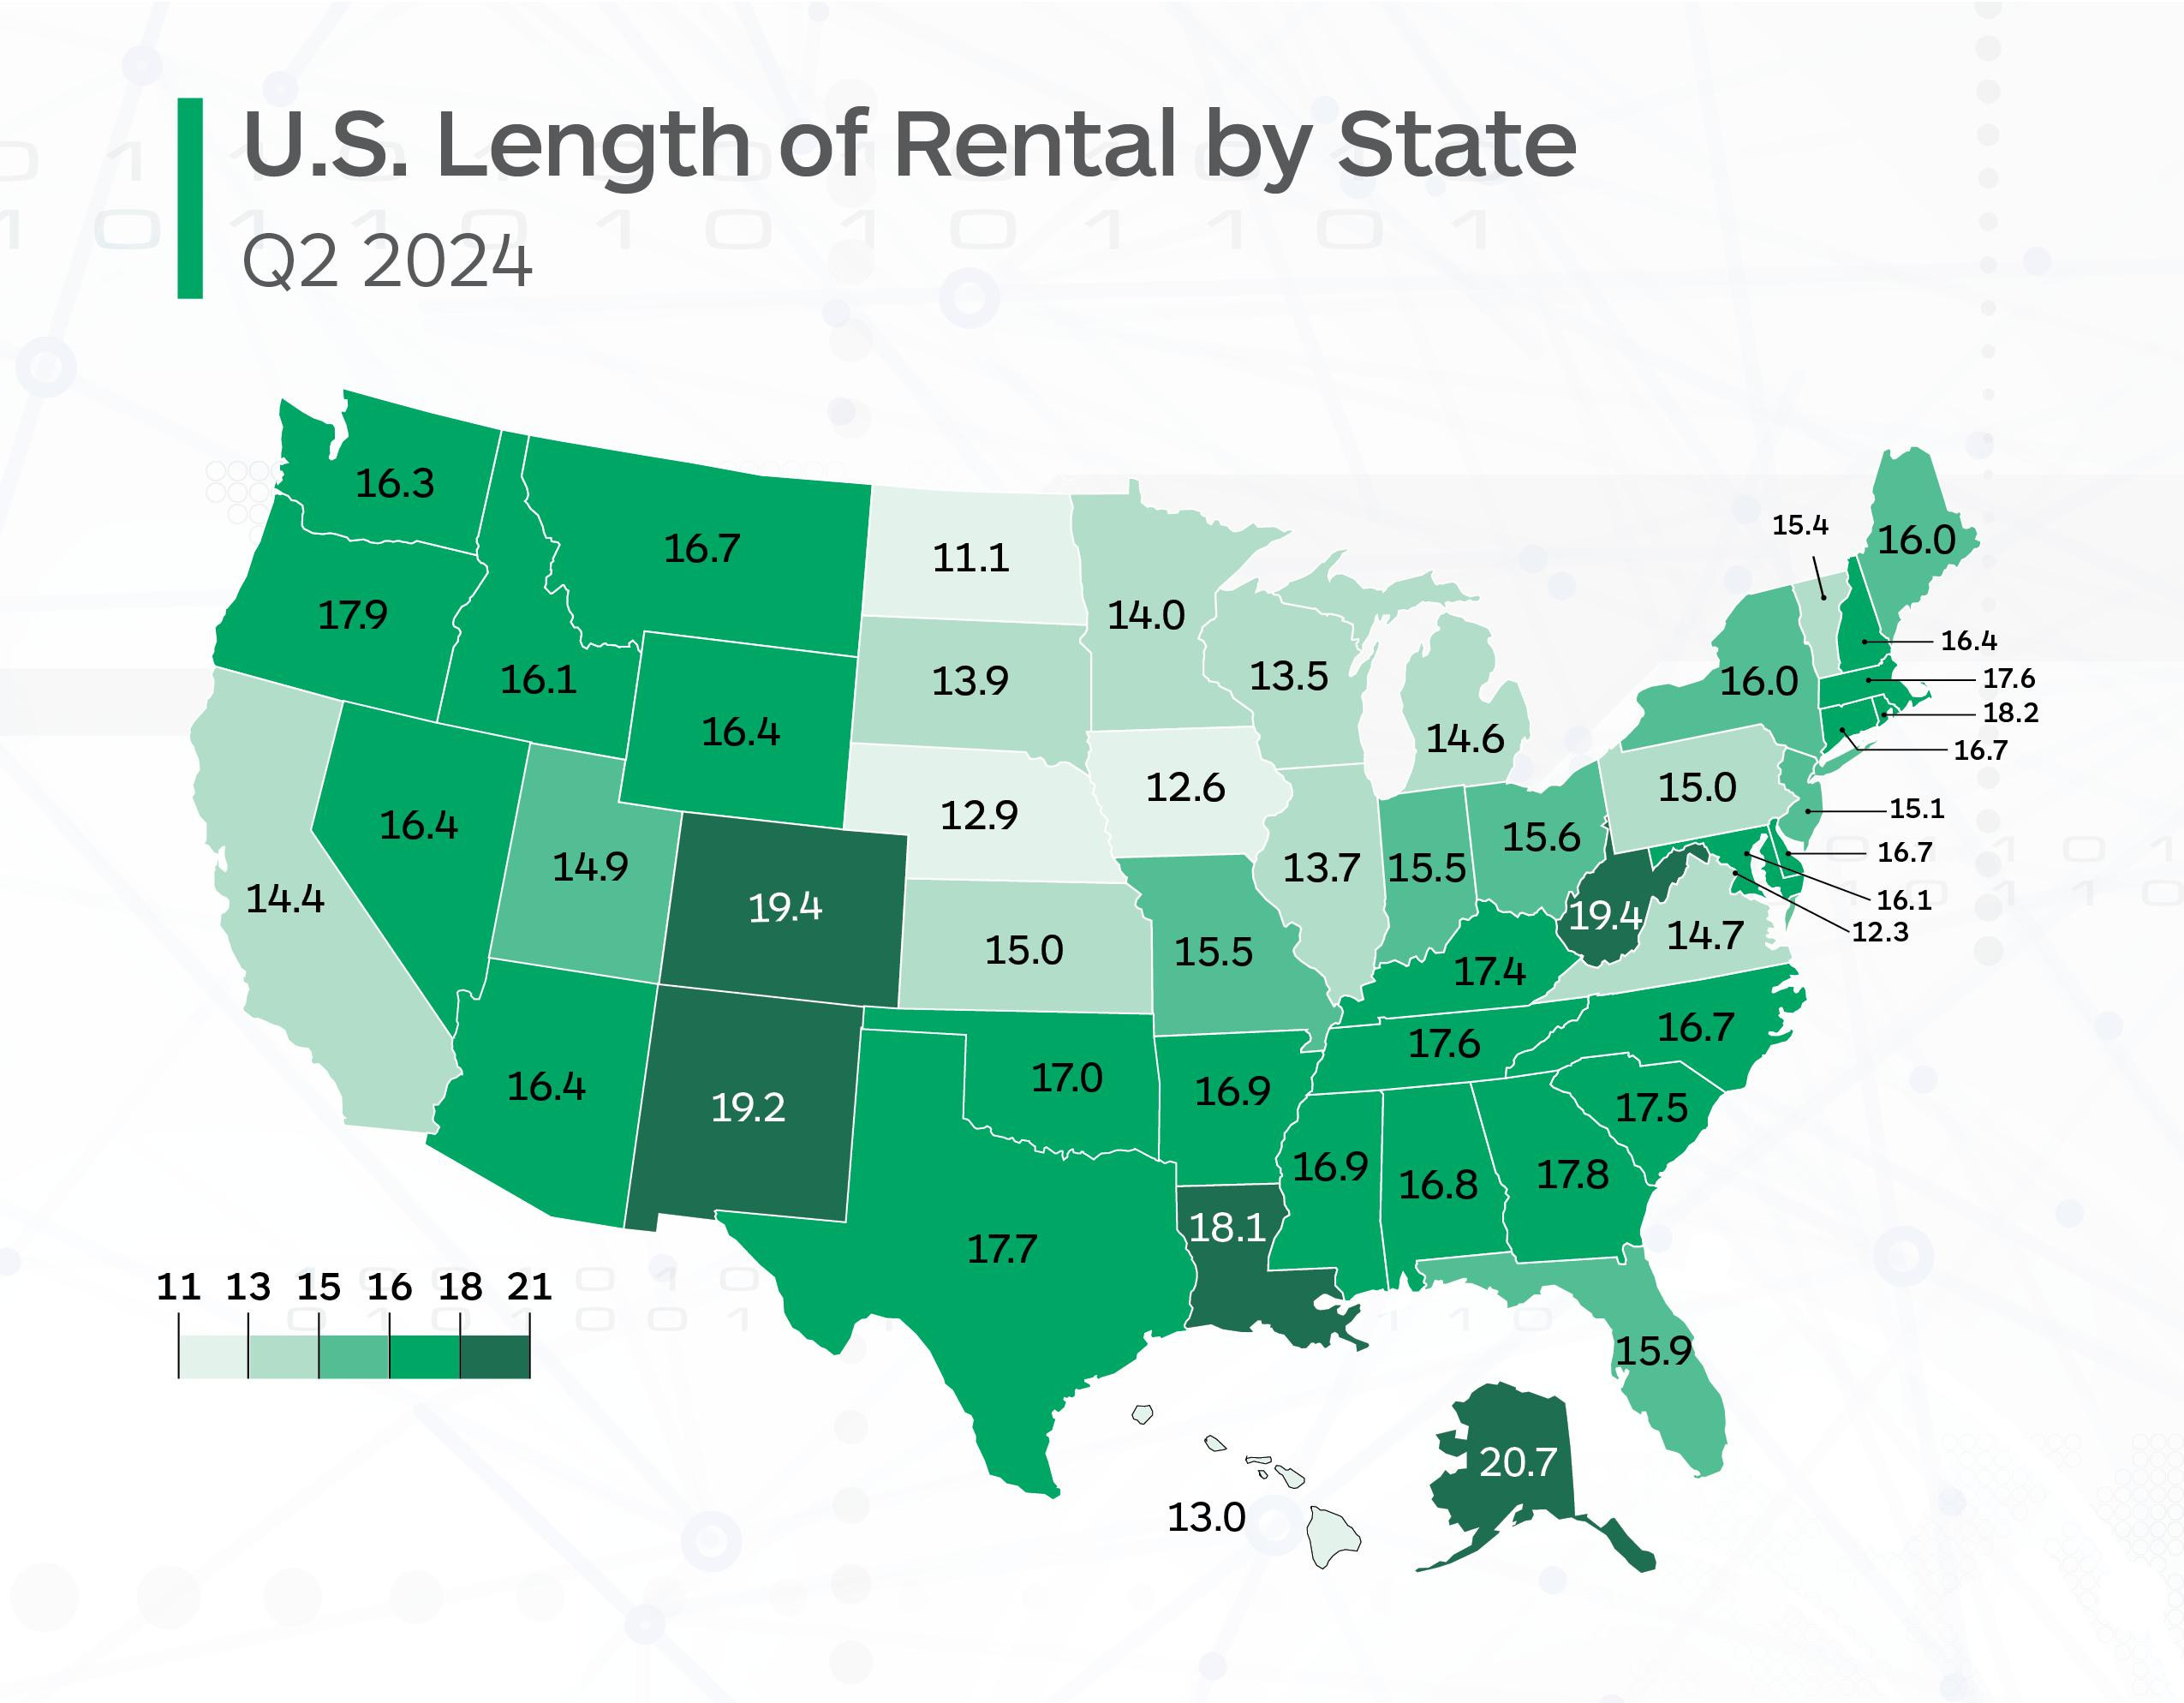 Image via Enterprise.
John Yoswick, editor of the weekly CRASH Network newsletter, said there was a "significant decline" in the average backlog of shops nationwide in Q2 compared to the first quarter of the year.
"Backlogs always drop from Q1 to Q2 each year, typically by two or three days. This year, however, backlog plummeted by nearly nine days in the second quarter -- the largest decline in backlog since the 10-day drop in the second quarter of 2020, at the start of the pandemic lockdowns," Yoswick said.
Yoswick noted shops may be working through the backlogs more quickly than in recent years because of successful hiring -- by mid-2023, there were 99,540 body technicians employed in the industry, an increase of more than 8,000 in just one year, according to data from U.S. the Department of Labor. The number of painters in the industry rose by 1,130 during the same period, nearly a 5% increase over the prior year.
Shops now have an average scheduling backlog of 2.7 weeks -- more than three weeks shorter than the high of 5.8 weeks reached in Q1 2023.
"That said, a 2.7-week average remains higher than any quarter prior to mid-2021, and nearly double the historical second quarter average of 1.4 weeks," Yoswick added. "Backlogs typically rise from Q2 to Q3 each year, so if the decline continues this summer, that will be surprising."
Yoswick said the results of a recent "Who Pays for What?" survey showed shops' revenue expectations for 2024, based on the first five months of the year, hit a four-year low in June -- another sign the pace of work is slowing.
More than half (54%) of about 400 responding shops said they expected revenues to be higher this year compared to last -- including 33% who expected an increase of 10% or more. But that was down from the same survey's findings in the second quarter of 2023, when 83% expected higher year-over-year revenues, and also down from the same period in 2022 (79%) and 2021 (66%). Nearly one in three shops (31%) expect 2024 revenues to fall short of the prior year, more than three times the number that thought that in the second quarter of 2022 and 2023.
"Three out of four collision repairers in the survey this spring said they had a positive or very positive outlook for their business over the coming 12 months. But that's the lowest percentage since 2020, including a 13-percentage point drop from a year earlier in the number who consider themselves 'very positive'", Yoswick said.
PartsTrader uses median delivery days, plus two standard deviations, to track parts delivery times and the impact of the outliers that can cause repair delays and increase length of rental.
PartsTrader's data for both Q2 2024 and June specifically fell in line with Enterprise's LOR data, said Greg Horn, PartsTrader's chief industry relations officer. Median delivery days for all part types decreased by 2.4 days year-over-year in Q2 2024, and in June, PartsTrader did not see the traditional "June bump" in that metric.
"We are seeing the collision parts ecosystem working well, having recovered from issues at the West Coast shipping ports and the UAW strike in 2023," Horn continued. "However, a situation to monitor is the potential of an East Coast and Gulf Coast dock strike this year. Hopefully, a deal can be reached to avoid any work stoppages."
Ryan Mandell, director of claims performance for Mitchell International, said the average first-party deductible amount continued to climb in Q2 2024, "signaling weakened consumer health and a higher likelihood of claims not being filed or insureds possibly dropping first-party coverage altogether as premiums have increased dramatically.
"In the U.S., the average first-party deductible rose to $832 in Q2 2024, up from $700 in Q2 2023. This is the largest year-over-year jump ever witnessed in our data," Mandell said.
Drivable Length of Rental
In Q2 2024, drivable LOR was 14.6 days, a 0.9-day drop from Q2 2023's 15.5 days. While this drop seems significant, it's also important to compare 2021 and 2022 results for additional context. In Q2 2022, LOR with rentals associated with drivable claims was 15.2 days, a 3.7-day increase from Q2 2021's result of 11.5 days. So, comparing Q2 2024 to Q2 2021, drivable LOR has increased 3.1 days.
As observed in the overall numbers, Alaska had the highest drivable LOR at 18.5 days, a 0.3-day decline from results in Q2 2023. Colorado had the next-highest drivable LOR at 18.0 days, a 0.4-day increase from Q2 2023.
North Dakota had the lowest LOR, dropping below the 10-day mark to 9.4 days. D.C. had the next-lowest LOR at 10.7 days, followed by Iowa at 11.3 days and Hawaii at 11.4 days.
West Virginia also recorded the highest drivable LOR increase at 16.4 days, up 1.4 days from Q2 2023. Maine, Missouri and New Mexico all had LOR increases of 0.6 days in Q2 2024.
Georgia (16.8) and Utah (13.5) had the joint-largest decreases in drivable LOR, both down 1.8 days, with Washington (15.0) close behind with a 1.7-day decrease. Overall, 17 states plus D.C. had drivable LOR decreases of one full day or greater.
Non-Drivable Length of Rental
Non-drivable LOR was 22.4 days in Q2 2024, a 3.2-day decrease from Q2 2023. While a significant decrease from Q2 2023's high water mark, comparing these results to Q2 2021 is also relevant. In Q2 2021, non-drivable LOR was 18.7 days, or 3.7 days lower than this quarter's results.
In Q2 2024, Alaska had the highest non-drivable LOR at 31.9 days, which in itself was a 3.5-day drop from Q2 2023. West Virginia had the next-highest LOR at 29.4 days, followed by Vermont (28.6) and New Mexico (28.4).
D.C. had the lowest non-drivable LOR at 18.5 days, followed by Iowa at 19.2 and Nebraska at 19.3.
Vermont had the only non-drivable LOR increase, with its 28.6-day result representing a 2.5-day jump.
Montana had the highest decrease, dropping eight full days from Q2 2023 to 28.0 days. Washington (-7.7) and North Dakota (-7.1) also experienced notable LOR drops. Twenty-eight other states had a decrease of 3.0 days or greater.
Total Loss Length of Rental
LOR for rentals associated with a total loss claim was 14.7 days, down 1.8 days from Q2 2023. Vermont had the highest total loss LOR at 19.2 days, followed by Hawaii (18.9) and West Virginia (17.9). South Dakota had the lowest LOR at 11.6 days. North Dakota (12.3) and Nebraska (12.9) had the next-lowest total loss LORs.
D.C. had the highest total loss LOR increase, with its 17.2-day result representing a 3.7-day rise. Vermont's highest result was a 1.9-day increase, while Hawaii (+0.8) and Maine (+0.2) were the only other states seeing an increase.
Otherwise, all other states saw total loss decreases, with Alaska (14.5) down 10.8 days. North Dakota was down 5.7 days, followed by South Dakota (-4.9) and Washington (-3.7).
Mandell said total loss frequency in the U.S. increased in Q2 2024 to 19.8%, up from 18.5% in Q2 2023.
"As vehicle values continue to decline, we expect total loss frequency to gradually increase as well, especially with severity gains not showing any signs of abating," Mandell said. "With more vehicles being written off, the higher dollar repairs are no longer flowing into repair facilities, and overall repairable volumes will decline, creating fewer bottlenecks and delays in repair facilities."